
Menu
Toolbar
Constraints/Results
Impedance Spectra
Equivalent Circuit
Settings
|
|

 EIS Spectrum Analyser
Help
EIS Spectrum Analyser
Help
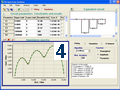
4. Impedance Spectra
Impedance data dependences on frequency are exposed as Nyquist or Bode plots in the Impedance Spectra panel. Use Graph submenus to switch between different representations.
Double click on the plot and choose Copy to Clipboard from a drop-down menu to copy a bitmap of the plot to the clipboard .
Double click on the plot and choose Graph Settings to change plot settings or curve attributes.
Double click on the plot and choose Clear Simulated Curve or Clear Experimental Curve to remove simulated or experimental spectra.
Right-click to allow zoom, maximize, rescale or copy the plot.
Click Point coordinates button (in the upper part of the Impedance Spectra panel) and click on a point to show its coordinates
Click Delete point button (in the upper part of the Impedance Spectra panel) and click an outlier point to remove it from the experimental spectrum.
Click Fragmentary Analysis button (in the upper part of the Impedance Spectra panel) to enter Fragmentary Analysis mode.
EIS Spectrum Analyser, 2008-13
|
|